|

|  GDB (GNU Debugger) Overview: How to Install, Pros & Cons, Price

GDB (GNU Debugger) Overview: How to Install, Pros & Cons, Price

November 14, 2024

Explore GDB (GNU Debugger): Discover its uses, installation guide, pros, cons, pricing info, and FAQs tailored for firmware developers.

What is GDB (GNU Debugger)

  Introduction to GDB (GNU Debugger)  

  • GDB, known as the GNU Debugger, is an essential tool for software and firmware engineers. It is part of the GNU system and is designed to offer powerful and versatile capabilities for debugging programs written in languages such as C, C++, and Fortran.
  Key Features of GDB  
  • It enables you to see what is going on inside your program while it executes or what it was doing at the moment it crashed.
  • GDB provides a rich set of commands for managing program execution, allowing you to pause execution, step through code line by line, or even step into functions.
  • With GDB, you can set breakpoints at specific lines of code, which are points where your program will temporarily stop running, so you can analyze the current state.
  Capabilities of GDB  
  • Inspect the values of variables and memory locations, which is crucial for identifying the source of an error or unexpected behavior.
  • Modify variable values and memory locations during runtime, offering tremendous flexibility to alter program states for testing and debugging purposes.
  • Analyze the call stack, helping you understand the sequence of function calls leading to a specific point in the program.
  Using GDB with Firmware  
  • Firmware engineers often use GDB to debug embedded systems and low-level software, as it supports cross-platform debugging with remote targets.
  • It allows connection to a target system over various interfaces such as JTAG and can integrate with simulators like QEMU for an efficient debugging environment.
  • By using GDB, engineers can trace back through hardware interaction layers and optimize their firmware for performance and reliability.
  Example Command to Start GDB   ``` gdb my_program ```  

What is GDB (GNU Debugger) Used for

  What is GDB Used For?  

  • GDB, the GNU Debugger, is primarily utilized by firmware engineers for finding and fixing bugs in software programs. It allows developers to see what is happening inside a program while it runs or what the program was doing at the moment it crashed.
  • Firmware developers use GDB to load the firmware on microcontrollers and then step through the firmware execution to diagnose issues. This process helps check the flow of execution and determine where errors may occur, especially in embedded systems where things are less transparent than on a full-scale operating system.
  • GDB supports debugging over JTAG (Joint Test Action Group), which is commonly used in firmware development for directly accessing the microprocessor and system state, thus allowing for comprehensive debugging of the firmware layers.
  • With GDB, developers can monitor variables, examine the call stack, and change the execution of the firmware in real time, which is beneficial for finding low-level bugs that might be hard to spot otherwise.
  Is GDB Still Used?  
  • Yes, GDB is still widely used and is far from being outdated. It is an essential tool for many developers, especially in the open-source community and among those working with low-level programming and embedded systems.
  • Despite the existence of many new debugging tools with graphical interfaces, GDB remains popular due to its robustness, versatility, and extensive support for different programming languages and environments.
  • Moreover, GDB continues to receive updates and has a strong community that contributes to its extension and improvement, ensuring it keeps up with modern development needs and technologies, such as support for remote debugging and integration with IDEs (Integrated Development Environments).
  • Additionally, GDB is known for its scripting capabilities which enable developers to create custom automated debugging routines, making it a powerful choice for many programming and debugging tasks.
 

Omi Necklace

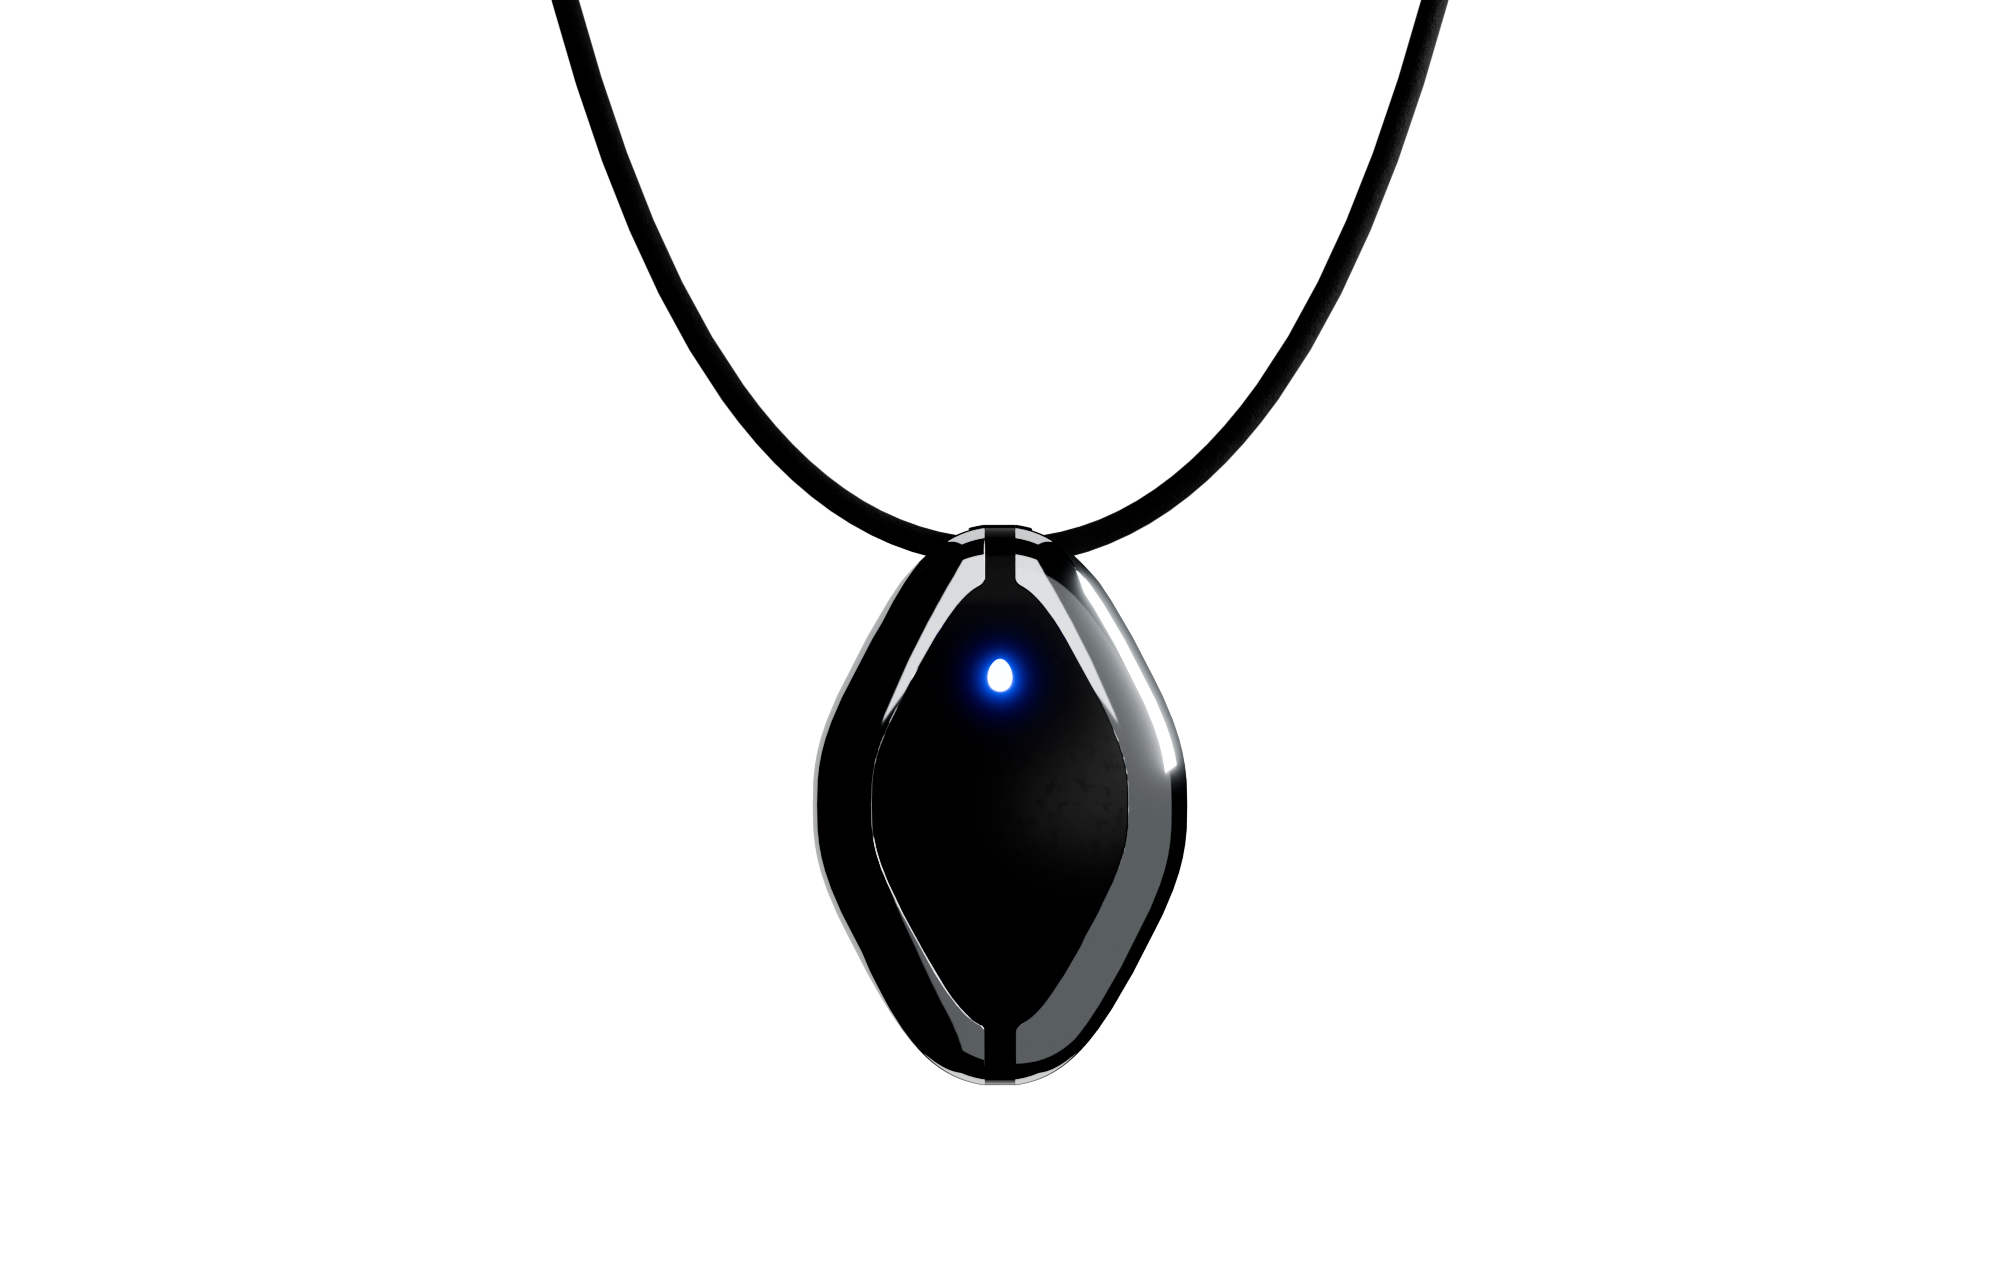
The #1 Open Source AI necklace: Experiment with how you capture and manage conversations.

Build and test with your own Omi Dev Kit 2.

Is GDB (GNU Debugger) Free

  Is GDB Free?  

  • GDB, the GNU Debugger, is a free software tool.
  • It is licensed under the GNU General Public License, which ensures that it remains free and open source.
  Is GDB Free for Commercial Use?  
  • Yes, GDB is free for commercial use, aligning with the terms of the GNU General Public License.
  • Businesses can use, modify, and distribute GDB within the compliant terms of this license.
 

What Devices Support GDB (GNU Debugger)

  Introduction to GDB Supported Devices  

  • General Purpose Computers: GDB is extensively used on general computing devices that run on Unix-like operating systems, including Linux, macOS, and others. It supports debugging for applications running on these systems.
  •  
  • Embedded Systems: GDB is a powerful tool for debugging embedded systems and can be used with a variety of processor architectures commonly found in embedded devices, such as ARM, AVR, MIPS, and more.
  •  
  • Digital Signal Processors (DSP): Many DSPs, which are used in applications requiring high-performance numerical computations, such as audio and video processing, can be debugged using GDB.
  •  
  • Microcontrollers: Microcontrollers like the widely used STM32 family can interact with GDB for low-level debugging. This often involves using JTAG or SWD (Serial Wire Debug) interfaces connecting through devices like STLink, JLink, or similar.
  •  
  • FPGAs with Embedded Cores: Some FPGAs that can host embedded processor cores (e.g., Xilinx Zynq or Intel SoC FPGAs) can use GDB to debug the software running on those cores.
  •  
  • Real-Time Operating Systems (RTOS): Devices running on RTOS can use GDB for debugging real-time applications when the RTOS provides support for it, often in conjunction with hardware debugging interfaces.
  •  
  • Cross-Compilation Environments: GDB is useful in cross-compilation setups where the development is done on one architecture (host) but targeted for another architecture (target). The remote debugging functionality of GDB is extensively leveraged in such scenarios.
  •  
  Connecting to Devices  
  • JTAG/SWD Interfaces: JTAG (Joint Test Action Group) and SWD (Serial Wire Debug) are popular hardware debugging interfaces that provide access to the internals of system-on-chips (SoCs) and microcontrollers, frequently used in conjunction with GDB.
  •  
  • Remote Debugging Protocols: GDB's remote debugging capabilities can be utilized to connect to devices over network connections. It uses the GDBserver agent on the target device to facilitate this.
  •  
 

Pros and Cons of GDB (GNU Debugger)

Comprehensive Functionality

  • GDB provides a broad range of features, including remote debugging, support for various languages, and multi-threaded application debugging. It stands up well against other debuggers like LLDB in terms of versatility.

Open Source and Extensible

  • As an open-source tool, GDB permits users to modify and extend its capabilities, something proprietary tools like IDA Pro limit. This is especially appealing for customization in firmware engineering.

Strong Community Support

  • With decades of use, GDB enjoys an active community offering a wealth of documentation and user-contributed customization options, often surpassing platforms with smaller user bases like WinDbg.

Steeper Learning Curve

  • Compared to straightforward interfaces like Visual Studio Debugger, GDB's command-line nature can be daunting for beginners, requiring significant time to master its full capabilities.

Performance Overhead

  • In certain scenarios, notably when debugging large-scale applications, GDB might introduce more performance overhead than optimized tools like the Visual Studio Debugger, potentially skewing debugging insights.

Limited GUI Support

  • While front-ends like DDD exist, GDB inherently lacks a robust built-in GUI, putting it at a disadvantage compared to user-friendly debuggers like IntelliJ IDEA Debugger, which offer rich interfaces.

Omi App

Fully Open-Source AI wearable app: build and use reminders, meeting summaries, task suggestions and more. All in one simple app.

Github →

How to Install GDB (GNU Debugger)

  Install Required Packages  

  • Open a terminal window on your system.
  •  
  • Update your package list by executing the command: sudo apt-get update for Debian-based systems or sudo dnf check-update for Red Hat-based systems.
  •  
  Install GDB via Package Manager  
  • For Ubuntu/Debian-based systems, type: sudo apt-get install gdb.
  •  
  • For Fedora/Red Hat-based systems, type: sudo dnf install gdb.
  •  
  • For Arch-based systems, you may use: sudo pacman -S gdb.
  •  
  Verify Installation  
  • Once installed, verify the installation by running: gdb --version in the terminal.
  •  
  • This command should return the installed version of GDB, confirming a successful installation.
  •  
  Install from Source (Optional)  
  • If you prefer to install GDB from source to access the latest features, download the source code from the official GNU website.
  •  
  • Extract the downloaded archive using: tar -xzvf gdb-version.tar.gz.
  •  
  • Navigate to the extracted directory: cd gdb-version.
  •  
  • Run the following commands sequentially: ./configure, make, and sudo make install.
  •  
  • Verify the installation using the gdb --version command as before.
  •  
  Troubleshooting Tips  
  • If you encounter permission issues, ensure that you have appropriate user permissions and re-run the commands with sudo.
  •  
  • For package not found errors, try updating your package manager's repository again with sudo apt-get update or sudo dnf check-update.
  •  
 

GDB (GNU Debugger) FAQ

How well does GDB integrate with popular development environments and IDEs for embedded systems?

  GDB Integration with IDEs  

  • GDB integrates well with many popular IDEs for embedded systems, providing a seamless debugging experience.
  •  
  • **Eclipse** has great GDB integration through the CDT plugin, offering graphical debugging features familiar to many developers.
  •  
  • **Visual Studio Code** supports GDB via extensions like C/C++ by Microsoft, enabling robust debugging capabilities.
  •  
  • For **JetBrains CLion**, GDB integration allows for remote debugging, making it suitable for embedded systems work.
  •  
  • **PlatformIO IDE** offers built-in support for debugging with GDB, enhancing development in embedded environments.
 

What features does GDB offer for remote debugging of firmware on embedded devices?

  Remote Debugging with GDB  

  • Use GDB Server: Deploy a GDB server on the embedded device for handling communication with the GDB client over a network.
  •  
  • Serial and TCP/IP Connections: Establish connections over serial ports or TCP/IP networks to facilitate communication between the host machine and the target device.
  •  
  • Target Descriptions: Utilize XML target descriptions to inform GDB about the architecture specifics of the embedded system, ensuring accurate debugging operations.
  •  
  • Memory and Watchpoint Access: Set breakpoints and watchpoints remotely to monitor specific memory locations or variable changes.
  •  
  • RTOS Awareness: Leverage RTOS plugins for GDB to debug embedded systems running a real-time operating system, providing task-specific insights.
 

Are there any specific limitations or challenges when using GDB with multi-threaded or real-time operating systems in firmware development?

  Challenges with GDB in Multi-threaded Environments  

  • Thread Management: Handling thread-specific breakpoints can be difficult, as GDB might not track thread changes efficiently.
  •  
  • Real-time Constraints: Interruptions by the debugger can affect timing-critical operations, leading to altered behavior or missed deadlines.
  •  
  • Synchronization Issues: Breakpoints can disrupt the synchronization between threads, potentially causing race conditions or deadlocks that aren't present without the debugger.
 

Order Friend Dev Kit

Open-source AI wearable
Build using the power of recall

Order Now

Join the #1 open-source AI wearable community

Build faster and better with 3900+ community members on Omi Discord

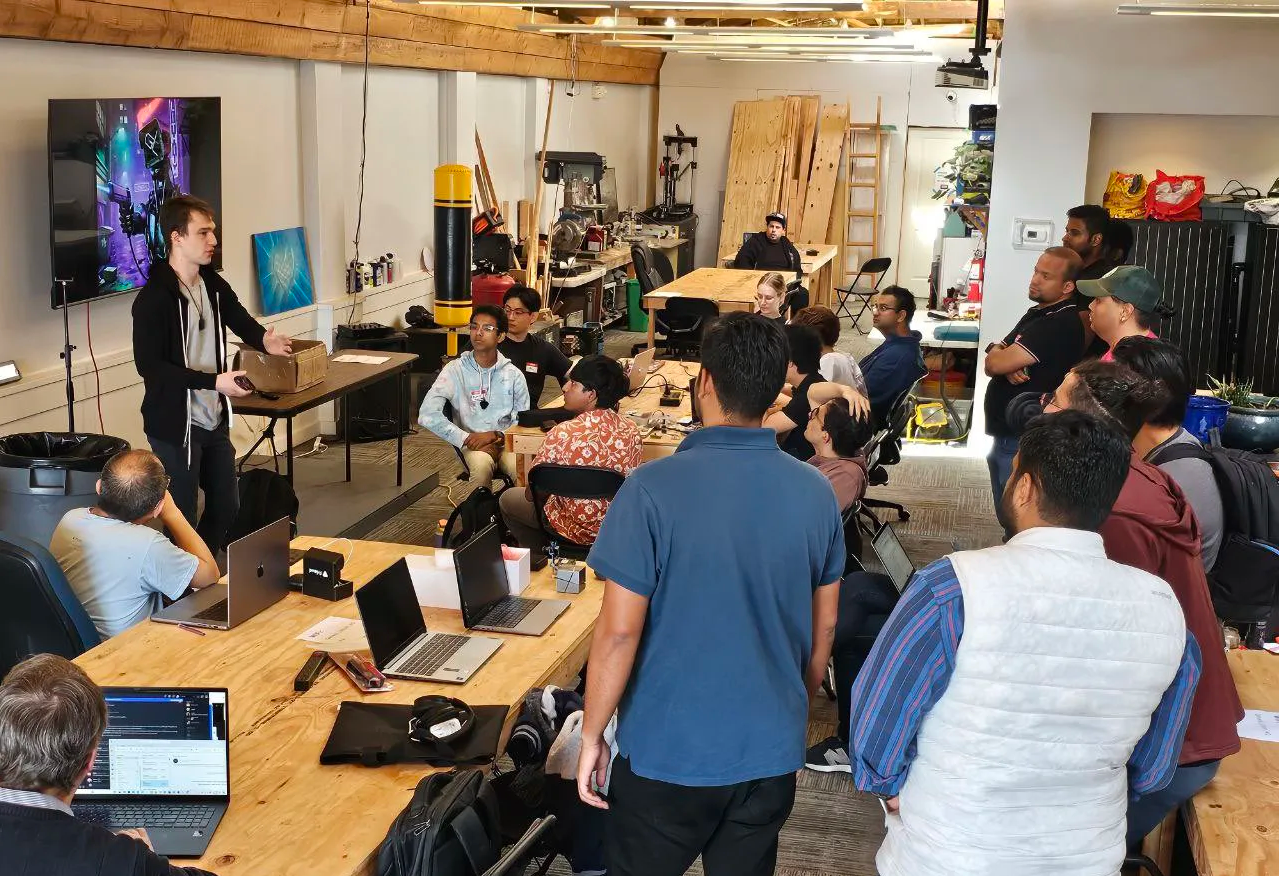
Participate in hackathons to expand the Omi platform and win prizes

Participate in hackathons to expand the Omi platform and win prizes

Get cash bounties, free Omi devices and priority access by taking part in community activities

Join our Discord → 

OMI NECKLACE + OMI APP
First & only open-source AI wearable platform

a person looks into the phone with an app for AI Necklace, looking at notes Friend AI Wearable recorded a person looks into the phone with an app for AI Necklace, looking at notes Friend AI Wearable recorded
online meeting with AI Wearable, showcasing how it works and helps online meeting with AI Wearable, showcasing how it works and helps
App for Friend AI Necklace, showing notes and topics AI Necklace recorded App for Friend AI Necklace, showing notes and topics AI Necklace recorded

OMI NECKLACE: DEV KIT
Order your Omi Dev Kit 2 now and create your use cases

Omi Dev Kit 2

Endless customization

OMI Necklace

$69.99

Make your life more fun with your AI wearable clone. It gives you thoughts, personalized feedback and becomes your second brain to discuss your thoughts and feelings. Available on iOS and Android.


Your Omi will seamlessly sync with your existing omi persona, giving you a full clone of yourself – with limitless potential for use cases:

  • Real-time conversation transcription and processing;
  • Develop your own use cases for fun and productivity;
  • Hundreds of community apps to make use of your Omi Persona and conversations.

Learn more

Omi Dev Kit 2: build at a new level

Key Specs

OMI DEV KIT

OMI DEV KIT 2

Microphone

Yes

Yes

Battery

4 days (250mAH)

2 days (250mAH)

On-board memory (works without phone)

No

Yes

Speaker

No

Yes

Programmable button

No

Yes

Estimated Delivery 

-

1 week

What people say

“Helping with MEMORY,

COMMUNICATION

with business/life partner,

capturing IDEAS, and solving for

a hearing CHALLENGE."

Nathan Sudds

“I wish I had this device

last summer

to RECORD

A CONVERSATION."

Chris Y.

“Fixed my ADHD and

helped me stay

organized."

David Nigh

OMI NECKLACE: DEV KIT
Take your brain to the next level

LATEST NEWS
Follow and be first in the know

Latest news
FOLLOW AND BE FIRST IN THE KNOW

San Francisco

team@basedhardware.com
Title

Company

About

Careers

Invest
Title

Products

Omi Dev Kit 2

Openglass

Other

App marketplace

Affiliate

Privacy

Customizations

Discord

Docs

Help