|

|  How to Integrate SAP Leonardo with Grafana

How to Integrate SAP Leonardo with Grafana

January 24, 2025

Discover step-by-step instructions to seamlessly connect SAP Leonardo with Grafana, enhancing your data visualization and analytics capabilities effortlessly.

How to Connect SAP Leonardo to Grafana: a Simple Guide


Set Up SAP Leonardo Environment


  • Ensure you have access to the SAP Cloud Platform and that SAP Leonardo services are enabled in your environment.
  •  

  • Configure and deploy your IoT or machine learning models on the SAP Leonardo platform as required for integration with Grafana.
  •  

  • Generate the necessary API keys for accessing SAP Leonardo services.


Install Grafana


  • Download and install Grafana using a package manager or the official Grafana website.
  •  

  • Start the Grafana server using the following command:


systemctl start grafana-server


  • Ensure Grafana starts automatically at boot by enabling it:


systemctl enable grafana-server


Configure SAP Leonardo Data Source in Grafana


  • Log in to your Grafana dashboard using your browser. The default URL is usually http://localhost:3000.
  •  

  • Navigate to the 'Data Sources' section and click on 'Add data source'.
  •  

  • Choose 'HTTP' as the data source type since SAP Leonardo can expose data through RESTful APIs.
  •  

  • Under the URL section, insert the endpoint URL of your SAP Leonardo API.
  •  

  • Set the authentication type according to your SAP Leonardo setup (e.g., API Key, OAuth, etc.). Enter the required credentials or API key.


Create a Dashboard in Grafana


  • Start by clicking on the '+' icon on the sidebar and choose 'Dashboard'.
  •  

  • Select 'Add New Panel' to create a new visualization for your SAP Leonardo data.
  •  

  • Choose a suitable visualization type based on the nature of the data (e.g., graph, table, heatmap).
  •  

  • In the Query section, construct a query to fetch the necessary data from SAP Leonardo API. Example:


GET /iot/data HTTP/1.1
Host: your-sap-leonardo-api-endpoint
Authorization: Bearer your-api-token


  • Use transformation functions provided by Grafana if you need to process data before visualization.


Test and Validate Integration


  • Review the initial data visualizations on your Grafana dashboard to ensure data is being correctly reflected from SAP Leonardo.
  •  

  • If any data discrepancies or errors are found, recheck connections, API endpoints, and authentication details.
  •  

  • Iterate over dashboard improvements by customizing panels, using different queries, and applying alerts if necessary.


Enhance with Advanced Features


  • Utilize Grafana's alerting feature to receive notifications based on data thresholds from SAP Leonardo services.
  •  

  • Configure additional data sources, if required, to combine SAP Leonardo data with other sources for a comprehensive dashboard.
  •  

  • Use filters and variables to create dynamic dashboards that are easy to navigate and tailor to different use cases.


Omi Necklace

The #1 Open Source AI necklace: Experiment with how you capture and manage conversations.

Build and test with your own Omi Dev Kit 2.

How to Use SAP Leonardo with Grafana: Usecases


Integrated Predictive Maintenance System


  • Introduction to Use Case: In modern industrial operations, predictive maintenance is crucial for minimizing downtime and reducing costs. Leveraging SAP Leonardo, an IoT and machine learning platform, along with Grafana, a visualization and monitoring tool, can provide a comprehensive solution for predictive maintenance by integrating automated analytics with real-time visualization.
  •  

  • Data Collection with SAP Leonardo: Utilize SAP Leonardo's IoT capabilities to collect data from various sensors attached to critical machinery. This data includes temperature, vibration, and operational status.
  •  

  • Data Processing: Implement machine learning models within SAP Leonardo to process the collected data. These models predict potential failures and maintenance needs by analyzing patterns and deviations in the sensor data.
  •  

  • Real-Time Monitoring: Use SAP Leonardo's real-time analytics to continuously monitor machine conditions and send alerts for any anomalies detected by the machine learning models. This ensures timely intervention before failures occur.
  •  

  • Data Visualization with Grafana: Integrate Grafana to visualize the data processed by SAP Leonardo. Grafana's customizable dashboards can display real-time updates, historical trends, and predictive insights from the machine learning models.
  •  

  • Benefits of Integration:
    • Improved Decision Making: Combining predictive analytics with rich, accessible visualizations enhances decision-making capabilities for operations managers.
    • Reduced Downtime: Predictive maintenance minimizes unscheduled downtimes by forecasting potential failures and suggesting timely maintenance tasks.
    • Cost Efficiency: Lower maintenance costs due to more efficient scheduling and reduced unnecessary inspections or replacements.
  •  

  • Technical Environment:
    • Deploy SAP Leonardo on cloud infrastructure for scalable data processing and analysis.
    • Set up Grafana on-premises or in the cloud, connected to SAP Leonardo's output data sources for seamless visualization.
  •  

  • Conclusion: The combination of SAP Leonardo's advanced data analytics with Grafana's intuitive visualization capabilities offers a robust solution for predictive maintenance. This setup enhances operational efficiency, reduces costs, and improves overall equipment effectiveness.


grafana-cli plugins install my-plugin


Smart Energy Management System


  • Introduction to Use Case: In contemporary energy management, optimizing energy consumption while ensuring sustainability is pivotal. By leveraging SAP Leonardo's capabilities for data gathering and machine learning, coupled with Grafana's superior visualization tools, organizations can implement an effective energy management system. This solution aids in monitoring, analyzing, and optimizing energy usage to achieve cost savings and sustainability goals.
  •  

  • Data Collection with SAP Leonardo: Utilize SAP Leonardo to connect to smart meters and IoT sensors across facilities to gather data on energy usage, generation, and distribution. This data includes metrics such as real-time energy consumption, peak loads, and energy flow across different departments.
  •  

  • Data Processing: Implement machine learning algorithms in SAP Leonardo to analyze the energy data. These algorithms can detect patterns, identify inefficiencies, and predict future energy consumption based on historical data and external factors such as weather conditions.
  •  

  • Real-Time Monitoring: Leverage SAP Leonardo’s real-time analytics to observe energy consumption and efficiency metrics on-the-fly. Alerts can be configured to notify facility managers when energy usage exceeds predefined thresholds, facilitating immediate corrective action.
  •  

  • Data Visualization with Grafana: Integrate Grafana to construct comprehensive dashboards that visualize energy consumption statistics, patterns, and predictions generated by SAP Leonardo’s analytics. Grafana allows for interactive and customizable dashboards, offering vivid insights into energy data across multiple time frames and operational contexts.
  •  

  • Benefits of Integration:
    • Enhanced Energy Efficiency: The integration allows for continuous monitoring and immediate insights into energy usage, facilitating timely interventions for increased efficiency.
    • Lower Operating Costs: By identifying and correcting inefficiencies, organizations can significantly reduce their energy costs over time.
    • Improved Sustainability: The system promotes sustainable energy consumption practices by optimizing energy usage and reducing waste.
  •  

  • Technical Environment:
    • Deploy SAP Leonardo on a robust cloud platform designed for big data processing and machine learning, ensuring scalability and flexibility.
    • Host Grafana either in the cloud or on-premises, ensuring it’s securely connected to SAP Leonardo's processed data outputs for effective visualization.
  •  

  • Conclusion: Integrating SAP Leonardo with Grafana creates a potent energy management system that not only optimizes energy consumption but also enhances sustainability and reduces costs. This synergy provides actionable insights, facilitating informed decisions that lead to significant operational and environmental benefits.


grafana-cli plugins install energy-monitoring-plugin
 

Omi App

Fully Open-Source AI wearable app: build and use reminders, meeting summaries, task suggestions and more. All in one simple app.

Github →

Order Friend Dev Kit

Open-source AI wearable
Build using the power of recall

Order Now

Troubleshooting SAP Leonardo and Grafana Integration

How to connect SAP Leonardo data to Grafana?


Setup SAP Leonardo Connectivity


  • Ensure SAP Leonardo IoT environment is operational and generate API keys for access.
  •  

  • Utilize SAP IoT APIs to fetch data, ensuring endpoint URLs and credentials are correct.


Install and Configure a Data Source Plugin in Grafana


  • In Grafana, install a generic REST API data source plugin for interfacing with SAP Leonardo.
  •  

  • Navigate to 'Configuration' > 'Data Sources' in Grafana and add a new data source.


Fetch Data into Grafana


  • Configure the data source with SAP Leonardo IoT API details, setting authentication and necessary headers.
  •  

  • Develop a query to extract data from SAP Leonardo using Grafana’s JSONPath or other query languages.


Create a Dashboard


  • Use the data source to create panels and visualize IoT data. Adjust variables and queries as needed for real-time insights.
  •  

  • Customize panels to best represent the specific data metrics imported from SAP Leonardo.


{
  "api_key": "your_generated_api_key",
  "base_url": "https://your.sap.leonardo.api"
}


Why is SAP Leonardo data not appearing in Grafana dashboards?


Check Data Source Configuration


  • Ensure that the SAP Leonardo data source is correctly configured in Grafana. Verify that the API endpoints, authentication details, and data mapping are properly set up.
  •  

  • Test the connection between Grafana and SAP Leonardo using a test query to confirm connectivity.


Verify Data Retrieval


  • Check if data is being retrieved from SAP Leonardo into Grafana. You can use Grafana's query inspector to debug data queries and inspect the response from SAP Leonardo.
  •  

  • Use the following command to test data retrieval:


curl -X GET "https://leonardo.api.your-instance/sap/data" -H "Authorization: Bearer YOUR_ACCESS_TOKEN"


Dashboard Configuration


  • Make sure your Grafana panels are configured correctly to display the data. Confirm the correct queries, time range, and visualization settings.
  •  

  • Review any transformations or variables applied to ensure they don't filter out data inadvertently.

How to troubleshoot authentication issues between SAP Leonardo and Grafana?


Check Network Connectivity


  • Verify network connections between SAP Leonardo and Grafana to ensure endpoints are reachable.


Review Authentication Configuration


  • Ensure authorization credentials in Grafana and SAP Leonardo match the configurations, such as keys and tokens.
  • Check allowed origins or IPs within SAP Leonardo settings to ensure Grafana addresses are permitted.


Verify User Permissions


  • Confirm user accounts have appropriate permissions within both systems to establish a secure connection.


Logs Analysis


  • Analyze SAP Leonardo and Grafana logs for any authentication-related errors or warnings.


Test Authentication Manually


  • Use curl or Postman to manually test API calls from Grafana to SAP Leonardo to isolate the issue.


curl -X GET "https://leonardo_api_endpoint" -H "Authorization: Bearer YOUR_TOKEN"


Check System Time Synchronization


  • Ensure both systems have synchronized time settings to avoid token expiration or validity issues.


Don’t let questions slow you down—experience true productivity with the AI Necklace. With Omi, you can have the power of AI wherever you go—summarize ideas, get reminders, and prep for your next project effortlessly.

Order Now

Join the #1 open-source AI wearable community

Build faster and better with 3900+ community members on Omi Discord

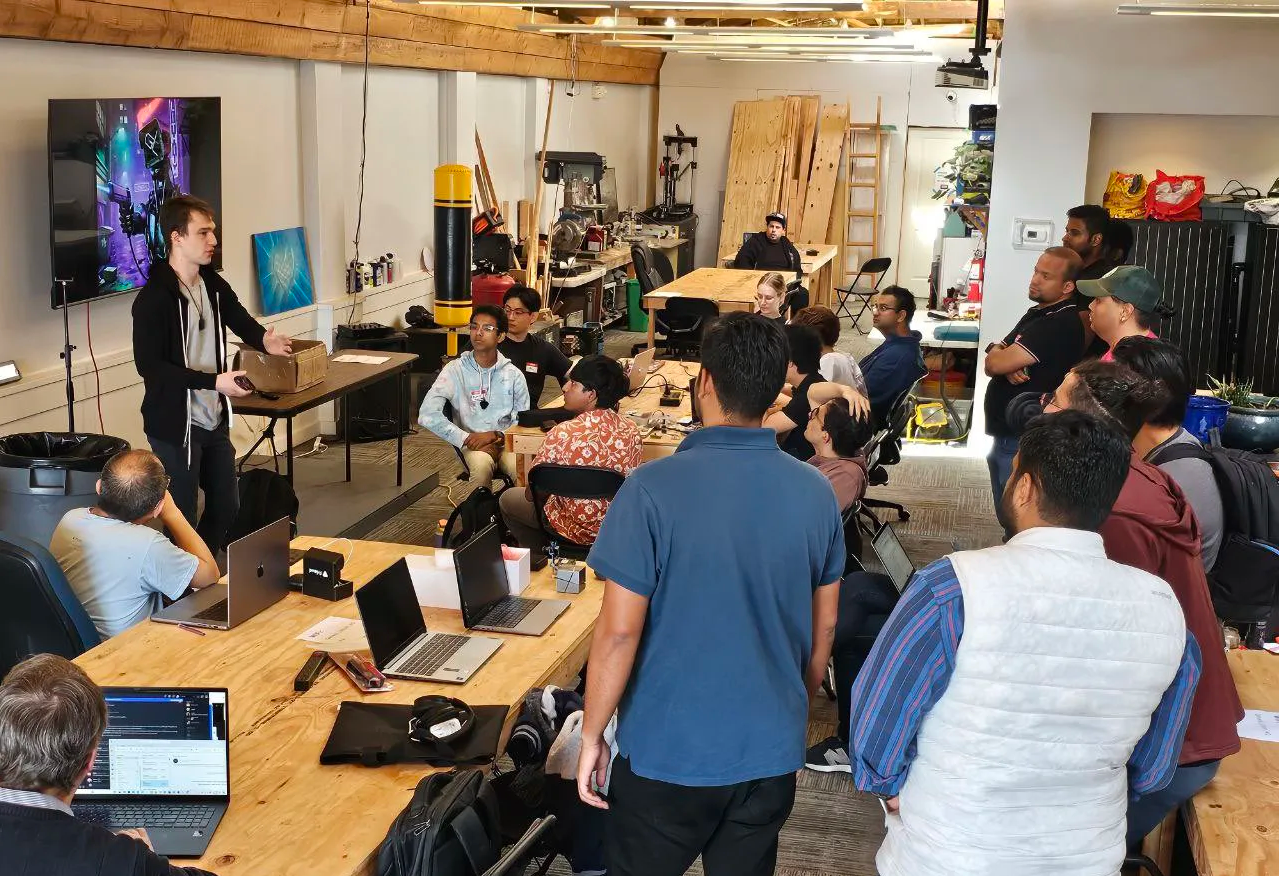
Participate in hackathons to expand the Omi platform and win prizes

Participate in hackathons to expand the Omi platform and win prizes

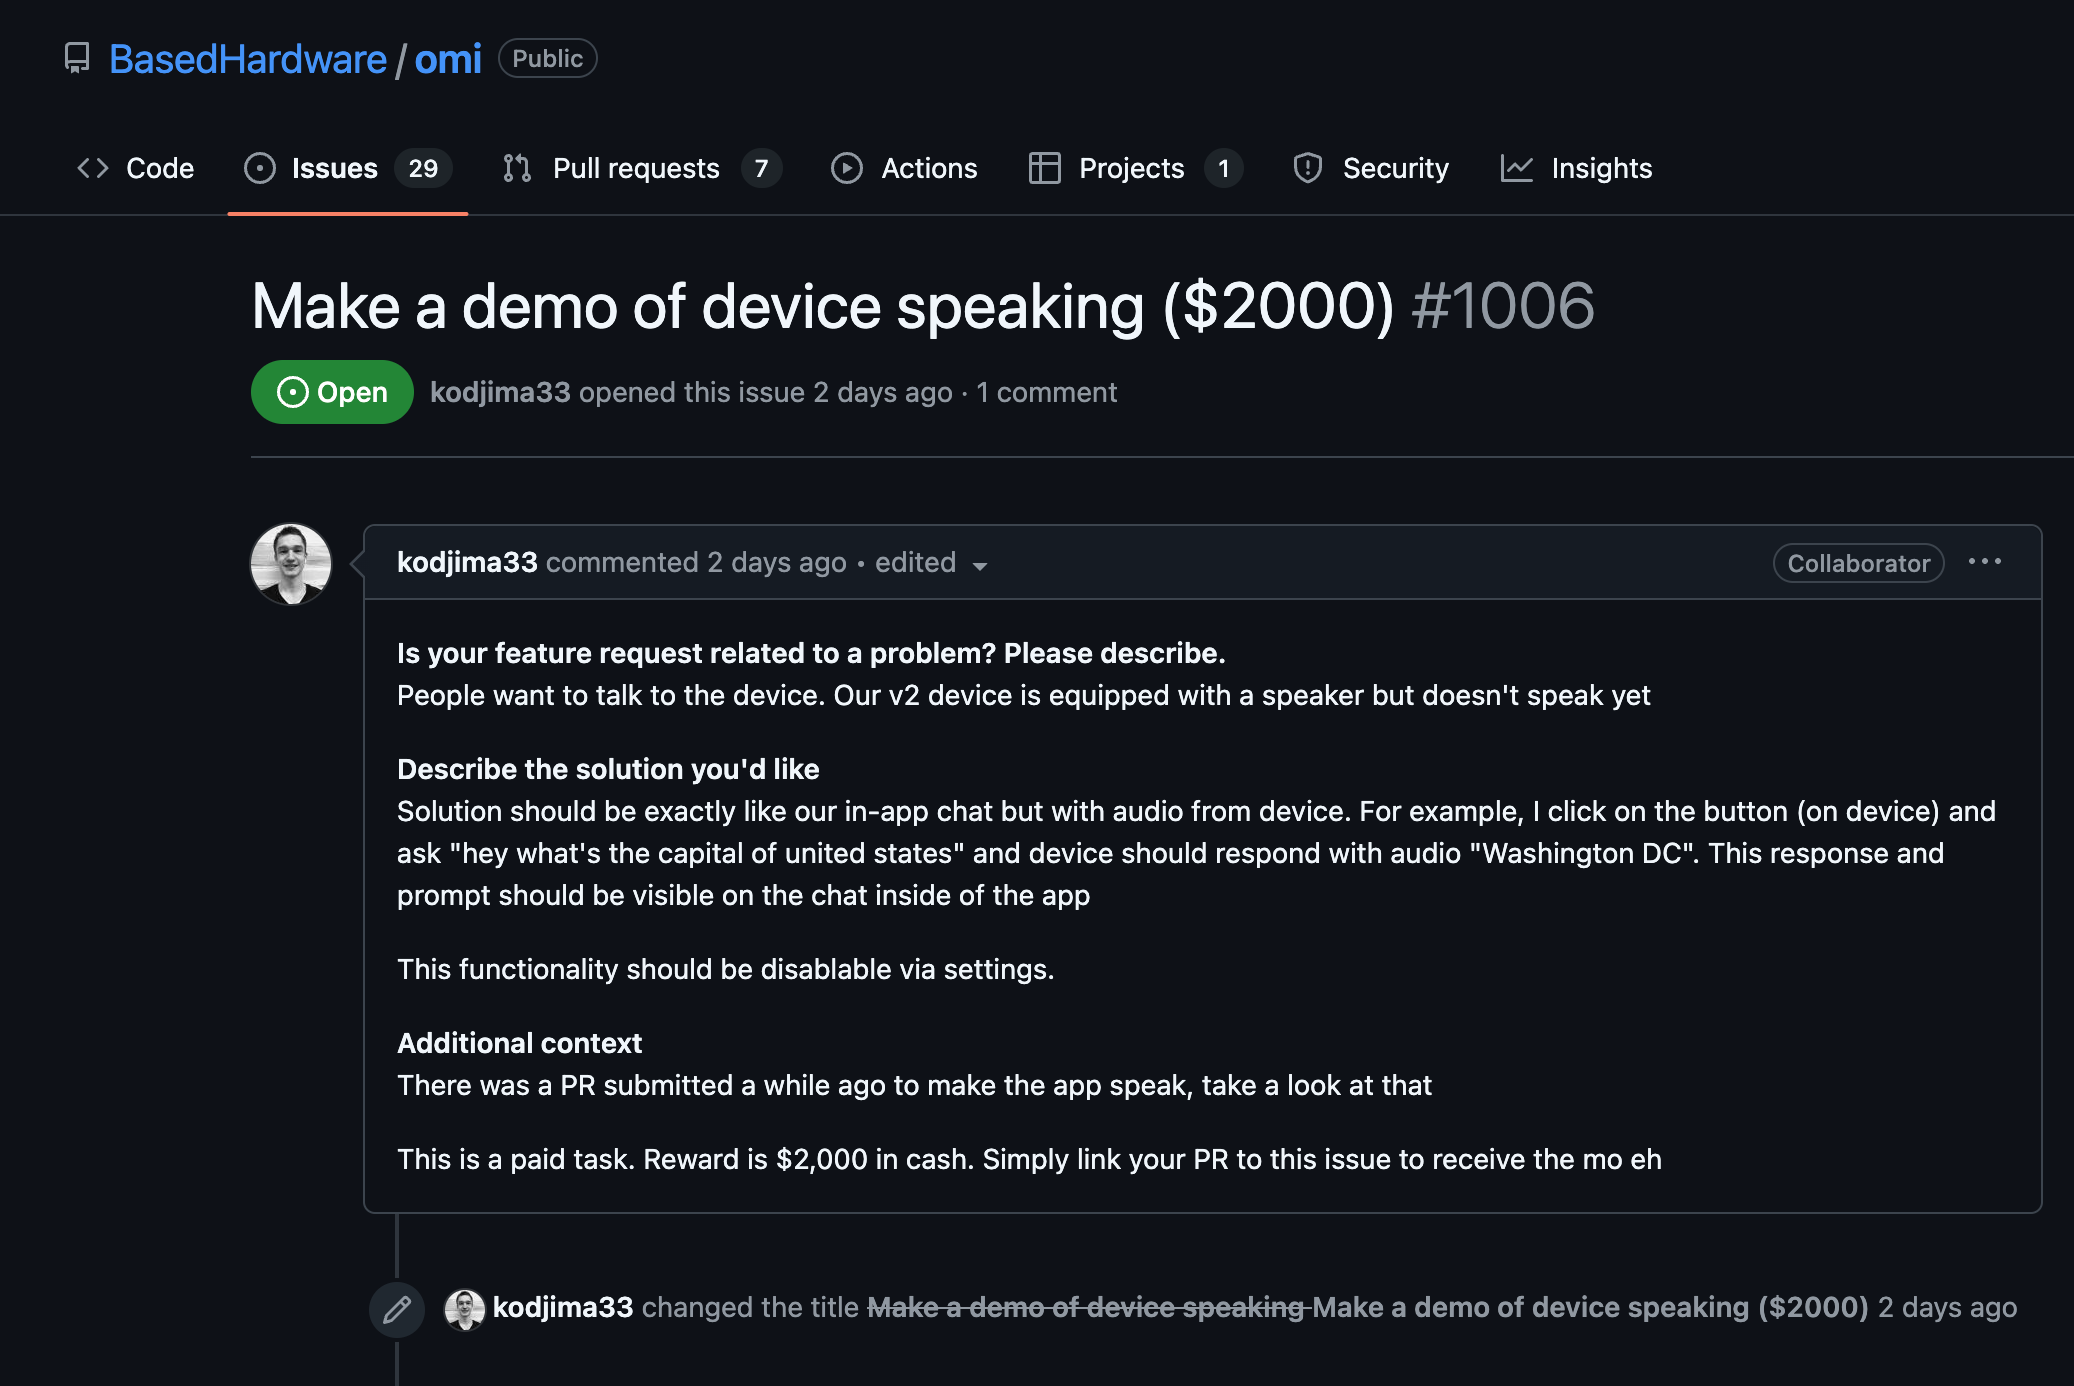
Get cash bounties, free Omi devices and priority access by taking part in community activities

Join our Discord → 

OMI NECKLACE + OMI APP
First & only open-source AI wearable platform

a person looks into the phone with an app for AI Necklace, looking at notes Friend AI Wearable recorded a person looks into the phone with an app for AI Necklace, looking at notes Friend AI Wearable recorded
online meeting with AI Wearable, showcasing how it works and helps online meeting with AI Wearable, showcasing how it works and helps
App for Friend AI Necklace, showing notes and topics AI Necklace recorded App for Friend AI Necklace, showing notes and topics AI Necklace recorded

OMI NECKLACE: DEV KIT
Order your Omi Dev Kit 2 now and create your use cases

Omi 開発キット 2

無限のカスタマイズ

OMI 開発キット 2

$69.99

Omi AIネックレスで会話を音声化、文字起こし、要約。アクションリストやパーソナライズされたフィードバックを提供し、あなたの第二の脳となって考えや感情を語り合います。iOSとAndroidでご利用いただけます。

  • リアルタイムの会話の書き起こしと処理。
  • 行動項目、要約、思い出
  • Omi ペルソナと会話を活用できる何千ものコミュニティ アプリ

もっと詳しく知る

Omi Dev Kit 2: 新しいレベルのビルド

主な仕様

OMI 開発キット

OMI 開発キット 2

マイクロフォン

はい

はい

バッテリー

4日間(250mAH)

2日間(250mAH)

オンボードメモリ(携帯電話なしで動作)

いいえ

はい

スピーカー

いいえ

はい

プログラム可能なボタン

いいえ

はい

配送予定日

-

1週間

人々が言うこと

「記憶を助ける、

コミュニケーション

ビジネス/人生のパートナーと、

アイデアを捉え、解決する

聴覚チャレンジ」

ネイサン・サッズ

「このデバイスがあればいいのに

去年の夏

記録する

「会話」

クリスY.

「ADHDを治して

私を助けてくれた

整頓された。"

デビッド・ナイ

OMIネックレス:開発キット
脳を次のレベルへ

最新ニュース
フォローして最新情報をいち早く入手しましょう

最新ニュース
フォローして最新情報をいち早く入手しましょう

thought to action.

Based Hardware Inc.
81 Lafayette St, San Francisco, CA 94103
team@basedhardware.com / help@omi.me

Company

Careers

Invest

Privacy

Events

Manifesto

Compliance

Products

Omi

Wrist Band

Omi Apps

omi Dev Kit

omiGPT

Personas

Omi Glass

Resources

Apps

Bounties

Affiliate

Docs

GitHub

Help Center

Feedback

Enterprise

Ambassadors

Resellers

© 2025 Based Hardware. All rights reserved.