|

|  How to Create Charts Using Google Charts API in JavaScript

How to Create Charts Using Google Charts API in JavaScript

October 31, 2024

Learn how to create interactive charts in JavaScript using Google Charts API. This guide covers setup, customization, and visualization techniques.

How to Create Charts Using Google Charts API in JavaScript


Loading the Google Charts Library


  • To start using Google Charts, you need to load the required JavaScript library. You can do this by including the Google Charts library in your HTML file. Inside the `` section, insert the script tag with the URL to load the library:
  • <script type="text/javascript" src="https://www.gstatic.com/charts/loader.js"></script>


  • After loading the main library, you must also load the specific packages you'll need. This is generally done within a script that you run once your page has loaded:
  • <script type="text/javascript">
        google.charts.load('current', {'packages':['corechart']});
    </script>


Creating a Chart Container


  • You need a container element to render your chart on the webpage. This is usually a `
    ` with specific dimensions to ensure your chart displays correctly. In your HTML body, add a `
    ` element with an id:
  • <div id="chart_div" style="width: 900px; height: 500px;"></div>


Preparing the Data


  • Create a JavaScript function to define and populate your data. Google Charts API uses a `DataTable` structure where data can be added in rows and columns format:
  • function drawChart() {
        var data = new google.visualization.DataTable();
        data.addColumn('string', 'Topping');
        data.addColumn('number', 'Slices');
        data.addRows([
            ['Mushrooms', 3],
            ['Onions', 1],
            ['Olives', 1],
            ['Zucchini', 1],
            ['Pepperoni', 2]
        ]);
    }


  • Within the `drawChart` function, we have defined column types and labels, then added rows of data to create the data table.


Configuring the Chart Options


  • Customizing the look and feel of your chart is achieved by setting various options. These options can include the chart title, axis titles, colors, and more. This is commonly set up using an object literal:
  • var options = {
        title: 'My Pizza Topping Chart',
        width: 900,
        height: 500,
        is3D: true
    };


Drawing the Chart


  • To render the chart, use a specific chart class provided by Google Charts that matches the chart type you want (e.g., `BarChart`, `LineChart`, etc.). Instantiate the chart using the previously created `div` container:
  • var chart = new google.visualization.PieChart(document.getElementById('chart_div'));
    chart.draw(data, options);


  • Be sure to call the `drawChart` function once the Google Charts library is fully loaded:
  • google.charts.setOnLoadCallback(drawChart);


Combining It All Together


  • Integrating all the sections above, your final HTML and JavaScript code would look something like this:
  • <!DOCTYPE html>
    <html>
    <head>
      <script type="text/javascript" src="https://www.gstatic.com/charts/loader.js"></script>
      <script type="text/javascript">
        google.charts.load('current', {'packages':['corechart']});
        google.charts.setOnLoadCallback(drawChart);
    
        function drawChart() {
          var data = new google.visualization.DataTable();
          data.addColumn('string', 'Topping');
          data.addColumn('number', 'Slices');
          data.addRows([
            ['Mushrooms', 3],
            ['Onions', 1],
            ['Olives', 1],
            ['Zucchini', 1],
            ['Pepperoni', 2]
          ]);
    
          var options = {
            title: 'My Pizza Topping Chart',
            width: 900,
            height: 500,
            is3D: true
          };
    
          var chart = new google.visualization.PieChart(document.getElementById('chart_div'));
          chart.draw(data, options);
        }
      </script>
    </head>
    <body>
      <div id="chart_div" style="width: 900px; height: 500px;"></div>
    </body>
    </html>


  • This complete HTML file, when opened in a browser, will display a 3D pie chart with the data you provided. The process can be adapted for other types of charts by changing the chart type and modifying options and data accordingly.
 

Limited Beta: Claim Your Dev Kit and Start Building Today

Instant transcription

Access hundreds of community apps

Sync seamlessly on iOS & Android

Order Now

Turn Ideas Into Apps & Earn Big

Build apps for the AI wearable revolution, tap into a $100K+ bounty pool, and get noticed by top companies. Whether for fun or productivity, create unique use cases, integrate with real-time transcription, and join a thriving dev community.

Get Developer Kit Now

OMI AI PLATFORM
Remember Every Moment,
Talk to AI and Get Feedback

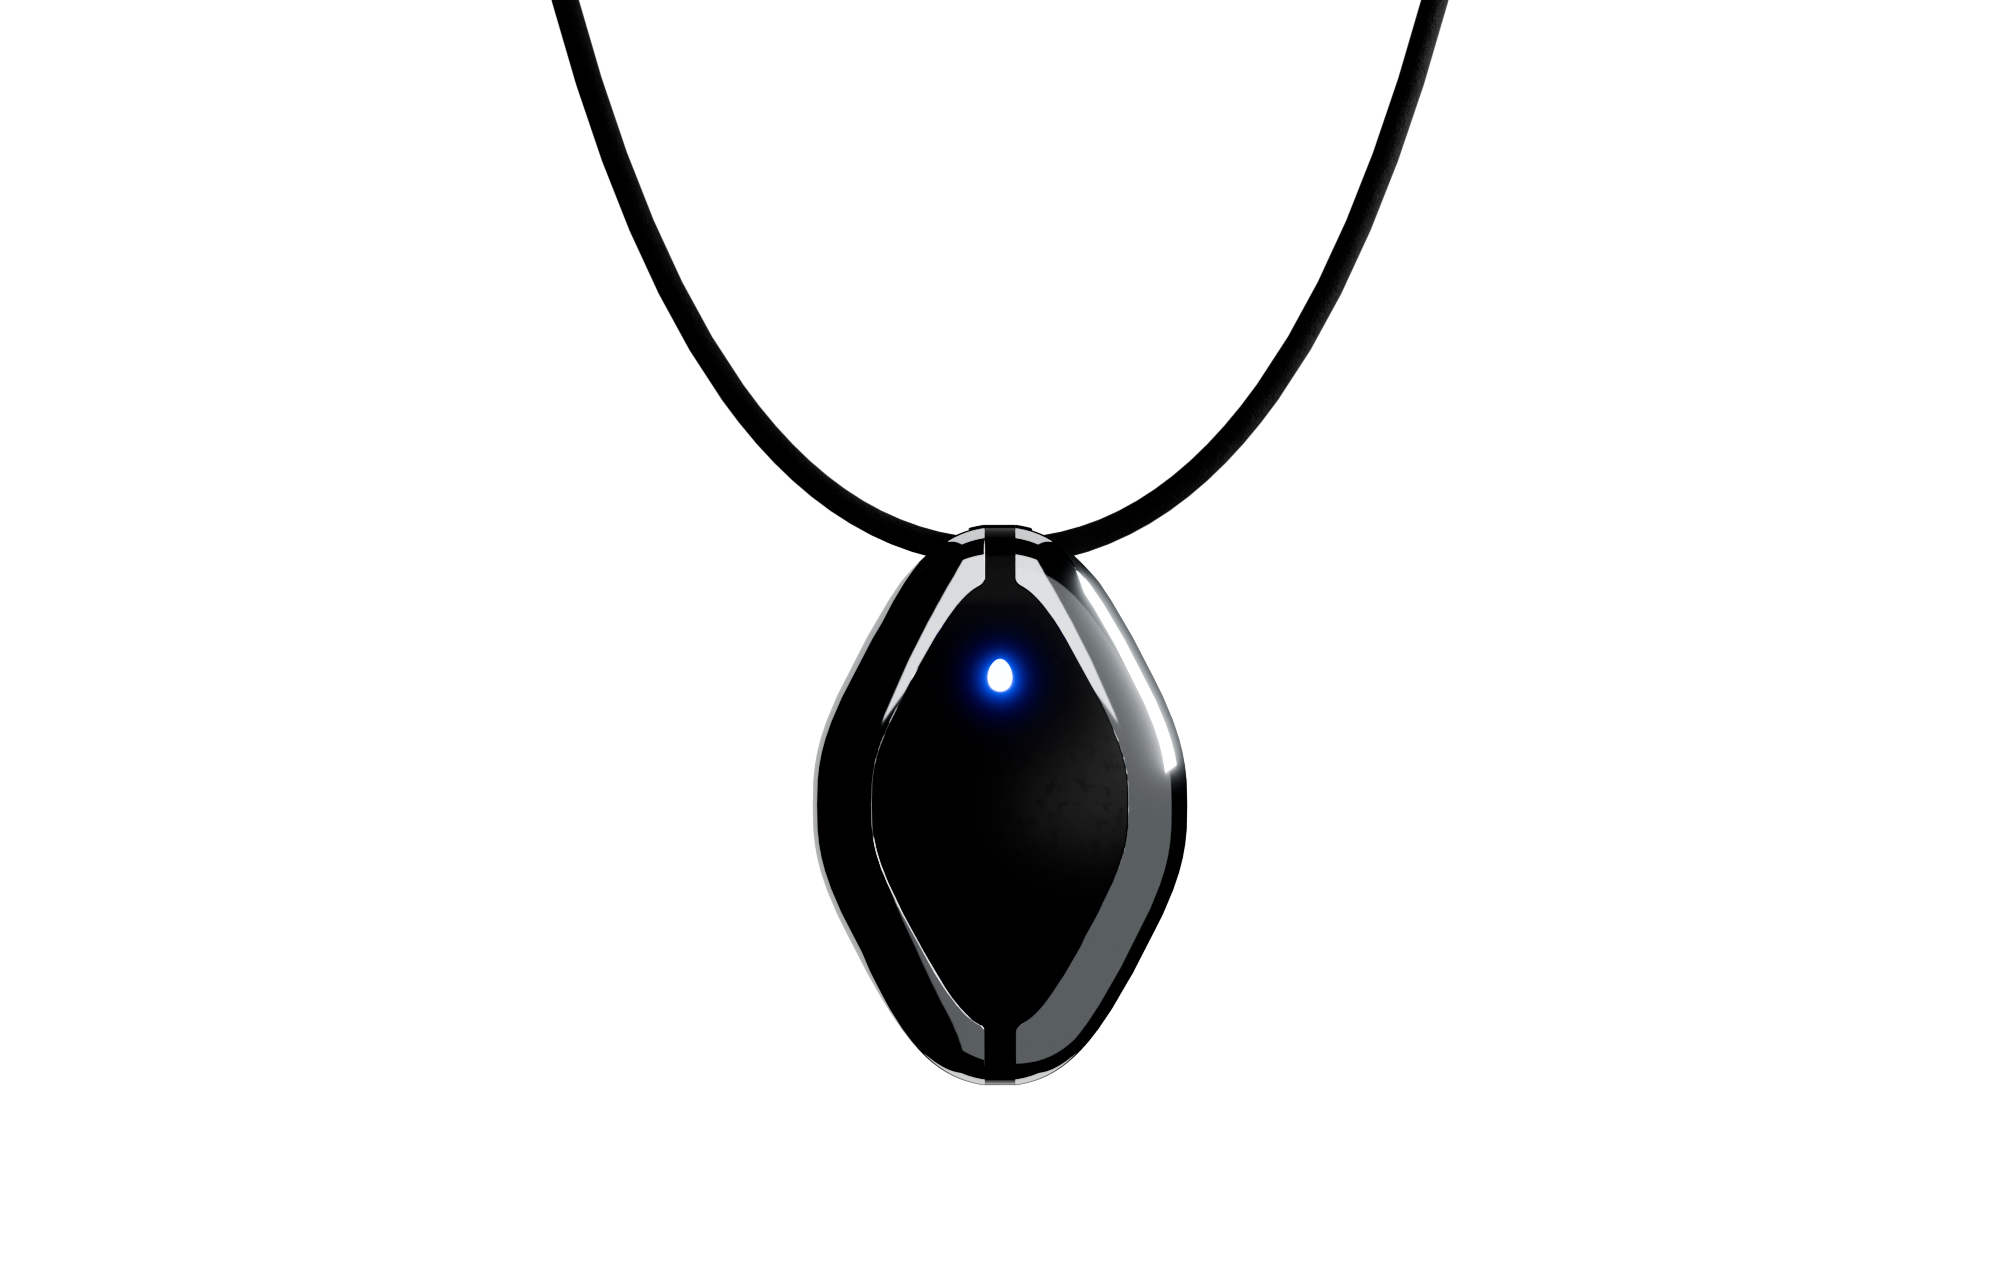
Omi Necklace

The #1 Open Source AI necklace: Experiment with how you capture and manage conversations.

Build and test with your own Omi Dev Kit 2.

Omi App

Fully Open-Source AI wearable app: build and use reminders, meeting summaries, task suggestions and more. All in one simple app.

Github →

Join the #1 open-source AI wearable community

Build faster and better with 3900+ community members on Omi Discord

Participate in hackathons to expand the Omi platform and win prizes

Participate in hackathons to expand the Omi platform and win prizes

Get cash bounties, free Omi devices and priority access by taking part in community activities

Join our Discord → 

OMI NECKLACE + OMI APP
First & only open-source AI wearable platform

a person looks into the phone with an app for AI Necklace, looking at notes Friend AI Wearable recorded a person looks into the phone with an app for AI Necklace, looking at notes Friend AI Wearable recorded
online meeting with AI Wearable, showcasing how it works and helps online meeting with AI Wearable, showcasing how it works and helps
App for Friend AI Necklace, showing notes and topics AI Necklace recorded App for Friend AI Necklace, showing notes and topics AI Necklace recorded

OMI NECKLACE: DEV KIT
Order your Omi Dev Kit 2 now and create your use cases

Omi 開発キット 2

無限のカスタマイズ

OMI 開発キット 2

$69.99

Omi AIネックレスで会話を音声化、文字起こし、要約。アクションリストやパーソナライズされたフィードバックを提供し、あなたの第二の脳となって考えや感情を語り合います。iOSとAndroidでご利用いただけます。

  • リアルタイムの会話の書き起こしと処理。
  • 行動項目、要約、思い出
  • Omi ペルソナと会話を活用できる何千ものコミュニティ アプリ

もっと詳しく知る

Omi Dev Kit 2: 新しいレベルのビルド

主な仕様

OMI 開発キット

OMI 開発キット 2

マイクロフォン

はい

はい

バッテリー

4日間(250mAH)

2日間(250mAH)

オンボードメモリ(携帯電話なしで動作)

いいえ

はい

スピーカー

いいえ

はい

プログラム可能なボタン

いいえ

はい

配送予定日

-

1週間

人々が言うこと

「記憶を助ける、

コミュニケーション

ビジネス/人生のパートナーと、

アイデアを捉え、解決する

聴覚チャレンジ」

ネイサン・サッズ

「このデバイスがあればいいのに

去年の夏

記録する

「会話」

クリスY.

「ADHDを治して

私を助けてくれた

整頓された。"

デビッド・ナイ

OMIネックレス:開発キット
脳を次のレベルへ

最新ニュース
フォローして最新情報をいち早く入手しましょう

最新ニュース
フォローして最新情報をいち早く入手しましょう

thought to action.

Based Hardware Inc.
81 Lafayette St, San Francisco, CA 94103
team@basedhardware.com / help@omi.me

Company

Careers

Invest

Privacy

Events

Manifesto

Compliance

Products

Omi

Wrist Band

Omi Apps

omi Dev Kit

omiGPT

Personas

Omi Glass

Resources

Apps

Bounties

Affiliate

Docs

GitHub

Help Center

Feedback

Enterprise

Ambassadors

Resellers

© 2025 Based Hardware. All rights reserved.