|

|  How to Implement Debug Interfaces (JTAG, SWD) in Your Firmware

How to Implement Debug Interfaces (JTAG, SWD) in Your Firmware

November 19, 2024

Discover a step-by-step guide to implementing JTAG and SWD debug interfaces in firmware, enhancing your embedded systems development and troubleshooting skills.

What is Debug Interfaces (JTAG, SWD)


Overview of Debug Interfaces


Debug interfaces are crucial elements in the development and testing of embedded systems. They provide a means to interface with and control microcontrollers and other chip-based systems during development phases. Two primary debug interfaces are JTAG and SWD, which serve as key protocols for accessing and modifying the system's internal state in real-time.


Joint Test Action Group (JTAG)


  • JTAG, which stands for Joint Test Action Group, is an industry-standard interface designed for testing integrated circuits.
  • It operates via a test access port (TAP), which is typically accessible through a combination of pins on a chip package.
  • The primary purpose of JTAG is boundary scan testing, but it's widely used for debugging, programming, and even system monitoring.
  • JTAG interfaces frequently feature multiple pins, such as TCK (Test Clock), TDI (Test Data In), TDO (Test Data Out), and TMS (Test Mode Select).


Advantages and Disadvantages of JTAG


  • Advantages:
    • Universality: JTAG serves a wide range of devices and manufacturers.
    • Comprehensive Debugging: Allows in-depth access to device registers, memory, and more.
  • Disadvantages:
    • Complexity: With its multiple pins, JTAG setups can be intricate and challenging to manage.
    • Size: The required footprint on PCBs can be larger compared to some alternatives.


Serial Wire Debug (SWD)


  • SWD, short for Serial Wire Debug, is a streamlined alternative to JTAG developed by ARM, primarily for use with its Cortex-M microprocessor line.
  • This protocol offers similar functionality to JTAG but utilizes far fewer pins — typically just a clock pin and a data pin, along with power and ground.
  • SWD is especially popular in resource-constrained environments where conserving pin usage and space on a microboard is crucial.


Advantages and Disadvantages of SWD


  • Advantages:
    • Efficiency: Uses fewer pins than JTAG, reducing complexity on the PCB.
    • Smaller Footprint: Ideal for systems where PCB space is at a premium.
  • Disadvantages:
    • Compatibility: Predominantly supports ARM devices, potentially limiting its application.
    • Reduced Debug Capability: In some configurations, SWD might not support all features offered by JTAG-like boundary scans.


Conclusion


Debug interfaces, particularly JTAG and SWD, provide essential capabilities for developing and troubleshooting embedded systems. While JTAG offers a comprehensive solution with broad support, SWD provides a space-efficient alternative tailored to ARM architectures. Understanding these interfaces' strengths and limitations is vital for optimizing design and development processes for embedded systems.
How to Implement Debug Interfaces (JTAG, SWD) in Your Firmware


Identify the Debug Interface


  • The first step is to identify the type of debugging interface your target hardware supports, typically JTAG or SWD. They are commonly used for ARM devices but can vary with different architectures.
  •  

  • Ensure that the hardware you are working with exposes the necessary pins for connecting a debugger - these are usually labeled as TCK, TMS, TDI, and TDO for JTAG, and SWDIO and SWCLK for SWD.


Set Up the Hardware Environment


  • Procure the right debugging adapter compatible with your microcontroller and IDE. Often, tools like the ST-Link or J-Link are used for ARM microcontrollers.
  •  

  • Connect the programmer to the development board using the appropriate connector (usually a 10-pin or 20-pin interface).
  •  

  • Ensure all connections are correct - a misconfiguration could lead to improper functioning or damaging the hardware.


Configure the Development Environment


  • Use an IDE that supports JTAG or SWD debugging interfaces. Examples include Keil, IAR Embedded Workbench, and VS Code with PlatformIO.
  •  

  • Install the related tools and drivers for your dongle or debugging adapter. For J-Link, this often involves Segger software; for ST-Link, the STM32 ST-LINK utility.
  •  

  • Within your IDE, configure it to recognize the debugger. This includes selecting the device family and setting the correct interface type (JTAG or SWD).


Initialize Debugging in Firmware


  • Enable debug support in your microcontroller’s firmware. This will involve setting appropriate flags and enabling peripheral clocks for the debug infrastructure, often through your firmware setup code.
  •  

  • In Structured Text or C code, you might need to set specific bits in control registers. For example, STM32 microcontrollers require enabling debug in sleep or standby modes:


DBGMCU->CR |= DBGMCU_CR_DBG_SLEEP |
              DBGMCU_CR_DBG_STOP |
              DBGMCU_CR_DBG_STANDBY;


Load and Test the Firmware


  • Compile the firmware with debugging information included. This is generally a setting in the build configuration of your IDE.
  •  

  • Program the microcontroller using the IDE's "debug" or "load" feature, ensuring that it uses the debugging interface (JTAG/SWD) for programming.
  •  

  • Ensure that breakpoints can be set and hit within your code, validating that the debugger is working effectively.


Troubleshooting Debugging Issues


  • Verify physical connections. The most common issues arise from loose cables or incorrect pin configurations.
  •  

  • Ensure your microcontroller is powered and the debugger can communicate. Some debuggers provide a power source to the target, while others require external power.
  •  

  • Check for correct initialization within your IDE settings—ensure the correct target processor and interface settings are selected.


Optimize Debugging Process


  • Utilize advanced debugging features like watchpoints, step-over, and trace capabilities, which can enhance the debugging process beyond basic execution control.
  •  

  • Investigate plugins or additional tools that can provide better insight tailored to your development platform or IDE.
  •  

  • Keep firmware projects manageable with abstraction layers or modular code to ease debugging and enhance code comprehension.


Omi Necklace

The #1 Open Source AI necklace: Experiment with how you capture and manage conversations.

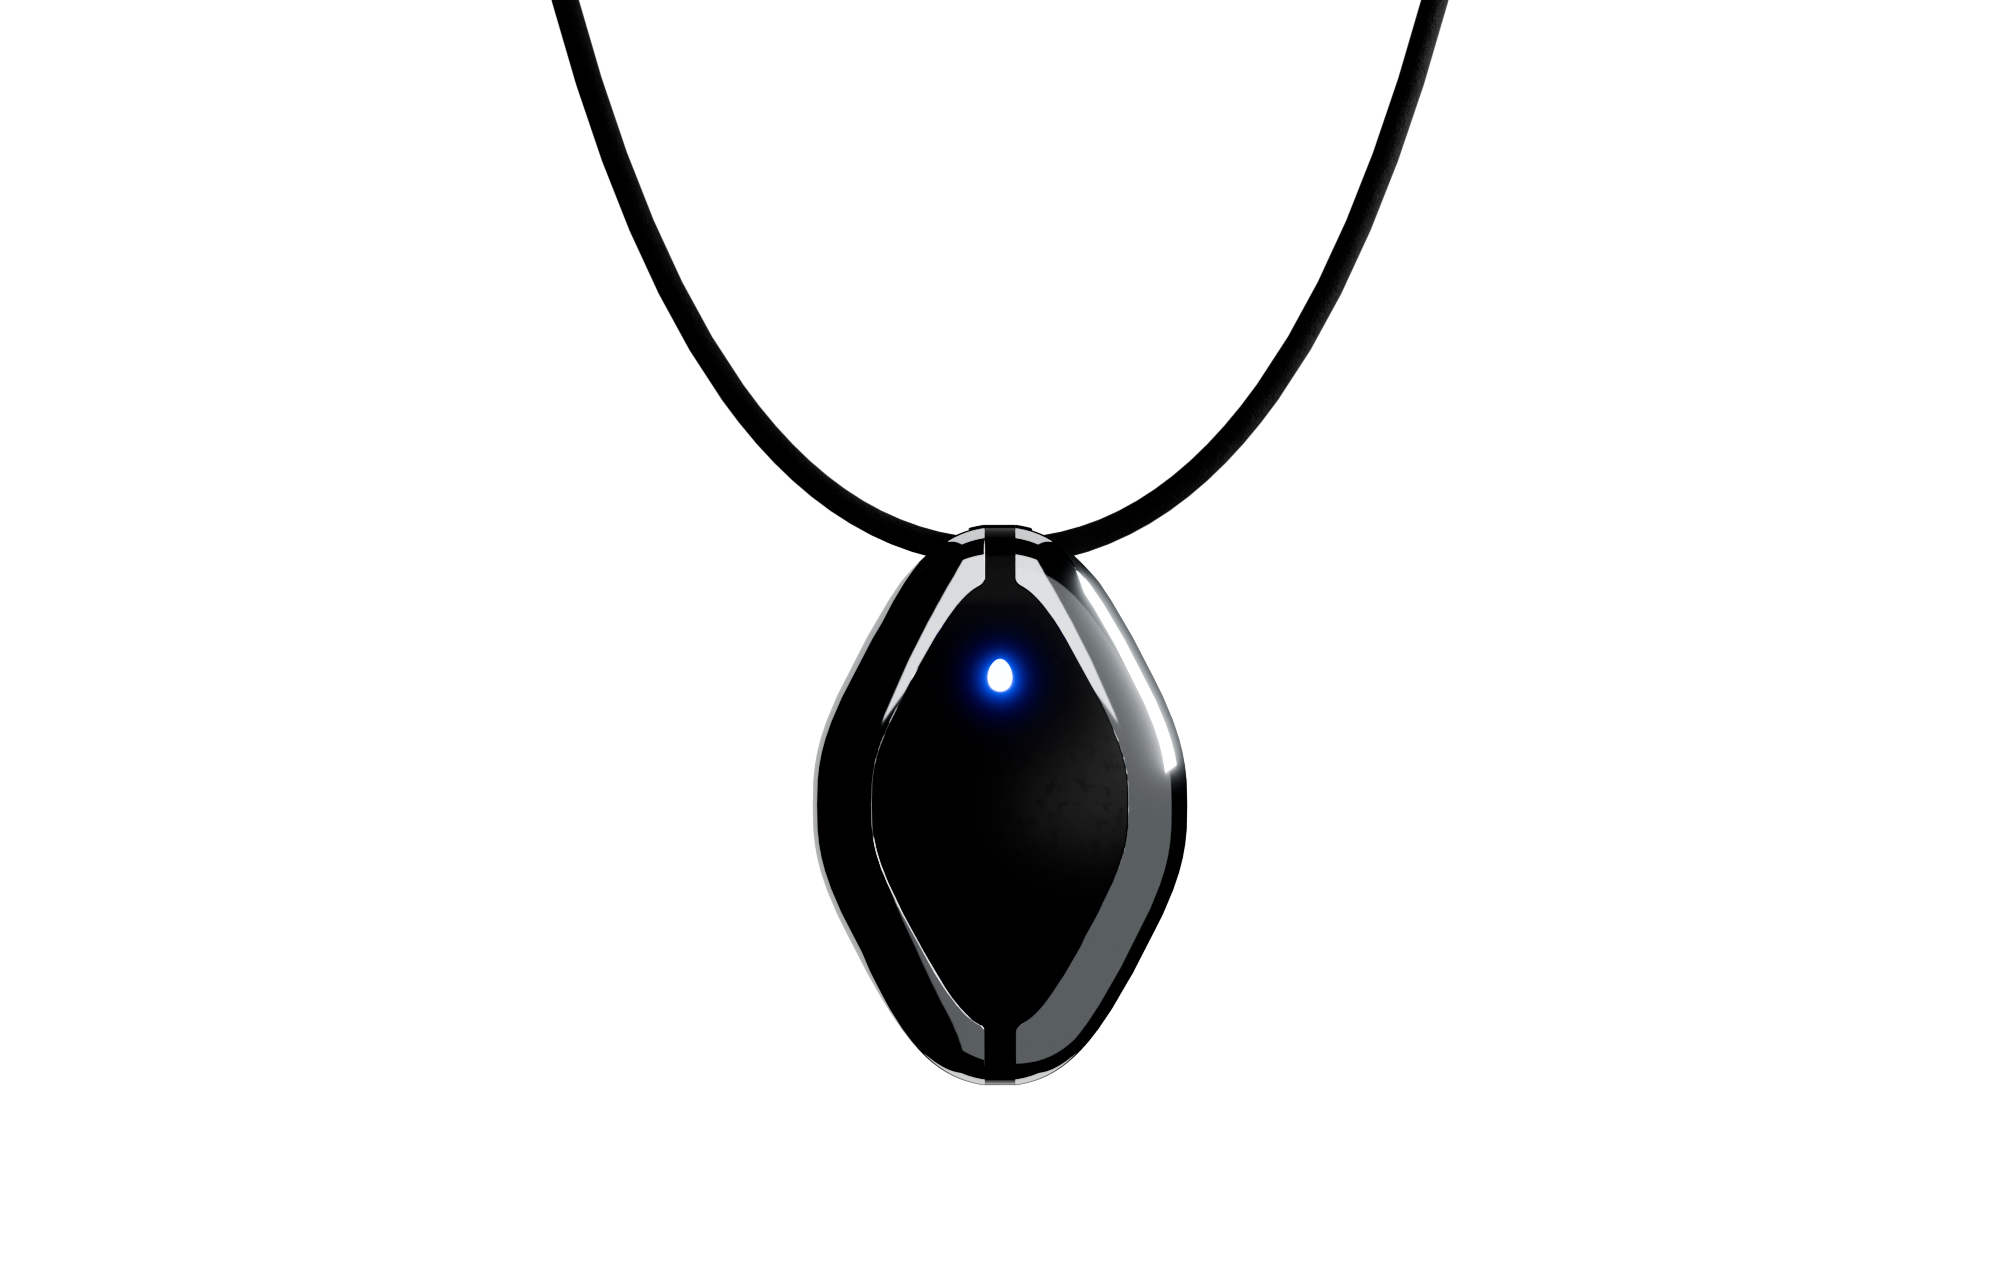
Build and test with your own Omi Dev Kit 2.

Omi App

Fully Open-Source AI wearable app: build and use reminders, meeting summaries, task suggestions and more. All in one simple app.

Github →

Order Friend Dev Kit

Open-source AI wearable
Build using the power of recall

Order Now

Join the #1 open-source AI wearable community

Build faster and better with 3900+ community members on Omi Discord

Participate in hackathons to expand the Omi platform and win prizes

Participate in hackathons to expand the Omi platform and win prizes

Get cash bounties, free Omi devices and priority access by taking part in community activities

Join our Discord → 

OMI NECKLACE + OMI APP
First & only open-source AI wearable platform

a person looks into the phone with an app for AI Necklace, looking at notes Friend AI Wearable recorded a person looks into the phone with an app for AI Necklace, looking at notes Friend AI Wearable recorded
online meeting with AI Wearable, showcasing how it works and helps online meeting with AI Wearable, showcasing how it works and helps
App for Friend AI Necklace, showing notes and topics AI Necklace recorded App for Friend AI Necklace, showing notes and topics AI Necklace recorded

OMI NECKLACE: DEV KIT
Order your Omi Dev Kit 2 now and create your use cases

Omi Dev Kit 2

Endless customization

OMI DEV KIT 2

$69.99

Make your life more fun with your AI wearable clone. It gives you thoughts, personalized feedback and becomes your second brain to discuss your thoughts and feelings. Available on iOS and Android.

Your Omi will seamlessly sync with your existing omi persona, giving you a full clone of yourself – with limitless potential for use cases:

  • Real-time conversation transcription and processing;
  • Develop your own use cases for fun and productivity;
  • Hundreds of community apps to make use of your Omi Persona and conversations.

Learn more

Omi Dev Kit 2: build at a new level

Key Specs

OMI DEV KIT

OMI DEV KIT 2

Microphone

Yes

Yes

Battery

4 days (250mAH)

2 days (250mAH)

On-board memory (works without phone)

No

Yes

Speaker

No

Yes

Programmable button

No

Yes

Estimated Delivery 

-

1 week

What people say

“Helping with MEMORY,

COMMUNICATION

with business/life partner,

capturing IDEAS, and solving for

a hearing CHALLENGE."

Nathan Sudds

“I wish I had this device

last summer

to RECORD

A CONVERSATION."

Chris Y.

“Fixed my ADHD and

helped me stay

organized."

David Nigh

OMI NECKLACE: DEV KIT
Take your brain to the next level

LATEST NEWS
Follow and be first in the know

Latest news
FOLLOW AND BE FIRST IN THE KNOW

thought to action

team@basedhardware.com

company

careers

invest

privacy

events

products

omi

omi dev kit

omiGPT

personas

omi glass

resources

apps

bounties

affiliate

docs

github

help